Bitcoin Price Prediction for Today, October 20: BTC/USD Gets Set For a Strong Rally Above $19k
As the daily chart reveals, the Bitcoin price prediction is showing positive signs and it is likely to accelerate higher in the near term.
Bitcoin Prediction Statistics Data:
- Bitcoin price now – $19,196
- Bitcoin market cap – $368.5 billion
- Bitcoin circulating supply – 19.1 million
- Bitcoin total supply – 19.1 million
- Bitcoin Coinmarketcap ranking – #1
BTC/USD Long-term Trend: Ranging (Daily Chart)
Key levels:
Resistance Levels: $22,000, $23,000, $24,000
Support Levels: $17,000, $16,000, $15,000
BTC/USD may have been stuck in a narrow range between $18,500 and $19,500 as the attempts to hit highs above $20,000 is yet to come into focus. At the time of writing, the Bitcoin price is hovering at $19,196 while facing a bearish building momentum. The Bitcoin price is currently consolidating with a few bearish signals. However, the recent correction to the upward fails near the $19,300 resistance level.
Bitcoin Price Prediction: What is the Next Direction for Bitcoin?
If the Bitcoin price fails to climb above the 9-day and 21-day moving averages, there could be more downside corrections. Meanwhile, the $19,000 level may continue to be a decent support zone while the next major support is near the $18,000 level. Any further losses might call for a drop toward the $17,000, $16,000, and $15,000 support levels.
However, if there is a clear break to the upside, the Bitcoin price could test the nearest resistance level at $20,000. If the bulls manage to gain strength above this level, there are chances of a decent recovery above the upper boundary of the channel as the key breakout zone is near the potential resistance levels at $22,000, $23,000, and $24,000 respectively. But the technical indicator Relative Strength Index (14) is seen moving below the 50-level, suggesting a sideways move into the market.
BTC/USD Medium-term Trend: Ranging (4H Chart)
The 4-hour chart shows that the Bitcoin price is trying to cross above the 9-day and 21-day moving averages. This pattern is considered bullish because it forms after a slight rise in price followed by a minor recovery. Should the price remain below the moving averages; it could reach the nearest support at $18,500 and below.
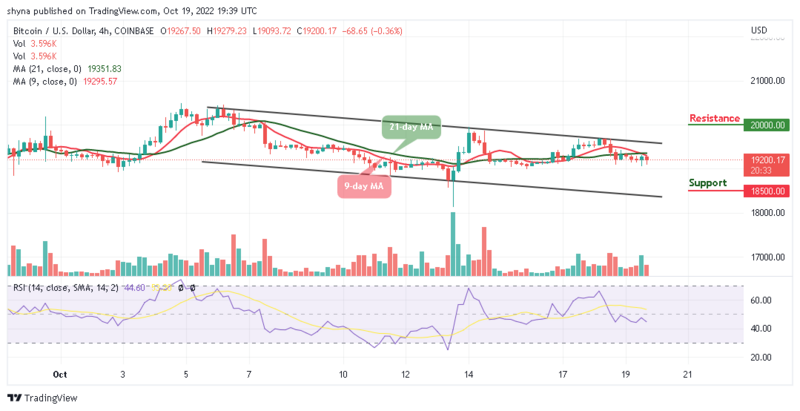
However, if the bulls push the coin above the upper boundary of the channel, it could hit the potential resistance level of $20,000, and above. At the moment, the market is likely to follow the bullish movement as the Relative Strength Index (14) moves to cross above the 60-level.
One alternative to Bitcoin is the IMPT token, which is on presale now at the link below and has raised $4.5 million so far.

Comments
Post a Comment