Bitcoin, Ethereum Technical Analysis: ETH Nears $1,230 Resistance, Following Strong US GDP Data
Ethereum edged closer to a key resistance level of $1,230 on Dec. 23, as markets continued to react to better than expected U.S. GDP data. Gross domestic product in the United States was revised higher to 3.2%, better than the 2.9% expected. Bitcoin mostly consolidated in today’s session, with prices trading near the $16,800 mark.
Bitcoin
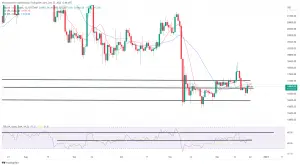
Bitcoin (BTC) was once again in consolidation on Friday, as markets continued to react to the latest U.S. Q3 GDP figures.
Following a low of $16,592.41 on Thursday, BTC/USD was marginally higher, with prices rising to a peak of $16,880.87 in today’s session.
The surge in price pushed BTC above a key resistance point of $16,800, as bulls once again attempted to recapture the $17,000 mark.

As can be seen from the chart, recent price uncertainty comes as the 14-day relative strength index (RSI) remains close to a floor at 45.00.
Sentiment also seems uncertain following a recent crossover between the red 10-day moving average, and its 25-day (blue) counterpart.
If this downward trend continues, we could see BTC trading near $16,000 during the Christmas weekend.
Ethereum
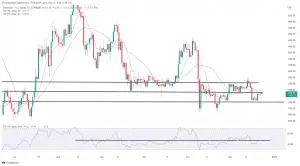
Ethereum (ETH) was marginally higher to end the week, as prices moved closer to a key resistance level earlier today.
ETH/USD raced to an intraday peak of $1,224.21 in Friday’s session, less than 24 hours after hovering at $1,187.13.
Today’s move sees ETH bulls once again try to break out of the long-term resistance level of $1,230.

Looking at the chart, the 14-day RSI is now rallying above a resistance point at 47.00, and tracking at 47.92, with the next visible ceiling at 52.00
In order for bulls to continue to push ethereum higher, price strength will likely need to surge towards this upcoming resistance of 52.00.
Register your email here to get weekly price analysis updates sent to your inbox:
Comments
Post a Comment