Polygon's Sideways Trend Continues And Confirms The High at $0.95

The price of Polygon (MATIC) is moving sideways above the moving average lines. Price Analysis by Coinidol.com.
Polygon Price Long Term Forecast: In the Range
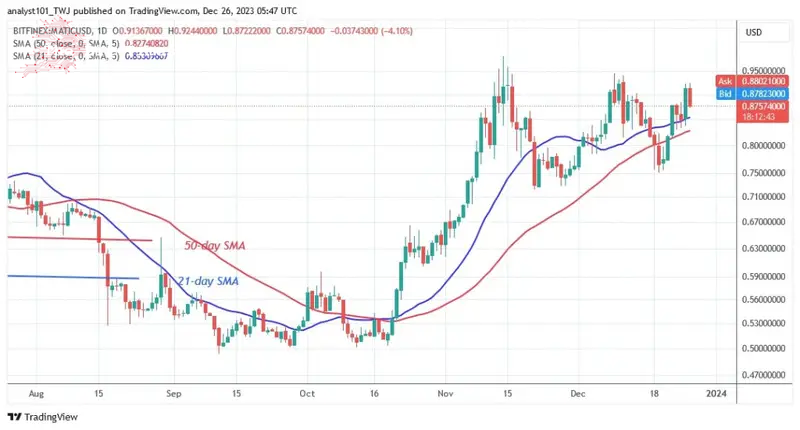
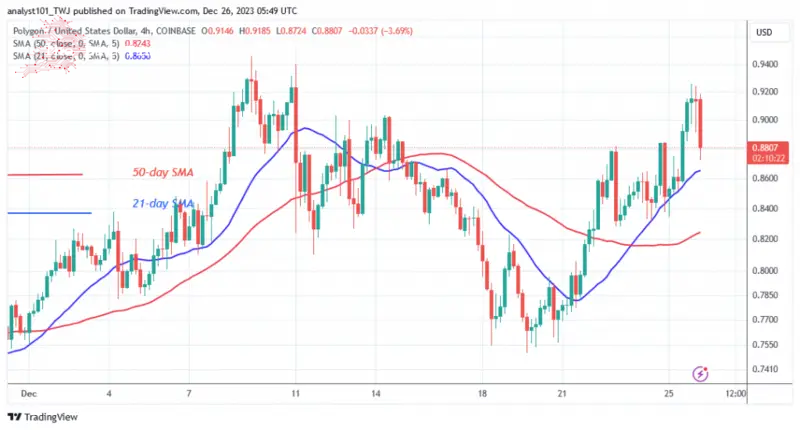
The MATIC price continues to be rejected at the overhead resistance level of $0.95. The digital asset is currently on a decline after hitting a high of $0.92. The upward movement is shaky due to long candle wicks. The wicks of the candles indicate significant selling pressure at higher price levels. Buyers have made three unsuccessful attempts to keep the price above the above resistance. If the buyers overcome the current resistance, Polygon will reach a high of $1.20. The buyers are defending the current price of $0.75 on the downside. The bulls have bought the dips twice as the altcoin falls above the current support.
Polygon indicator analysis
After the recent dip, the price bars have recovered above the moving average lines. This suggests that the resistance above could be tested again. The sideways trend continues as the moving average lines are horizontal.
Technical indicators
Resistance levels: $1.20, $1.30, $1.40
Support levels: $0.60, $0.40, $0.30

What is the next move for Polygon?
Polygon remains trapped in its price range of $0.75 to $0.95. Today, MATIC has retreated and found support above the 21-day simple moving average. The price of the cryptocurrency is set to rise once again to retest the overhead resistance of $0.95. If the current support and resistance levels are broken, the altcoin will develop a trend.
Coinidol.com reported previously that the upward correction ended on November 14 with a high of $0.95. MATIC has slipped between the moving average lines after two rejections.

Disclaimer. This Analysis and forecast are the personal opinions of the author and are not a recommendation to buy or sell cryptocurrency and should not be viewed as an endorsement by CoinIdol.com. Readers should do the research before investing in funds.
Comments
Post a Comment